Economy
G20 Inflation Rates: Feb 2024 vs COVID Peak
![]() See this visualization first on the Voronoi app.
See this visualization first on the Voronoi app.
How Far Have Inflation Rates Fallen Across the G20?
This was originally posted on our Voronoi app. Download the app for free on iOS or Android and discover incredible data-driven charts from a variety of trusted sources.
A major economic consequence that arose in the aftermath of the COVID-19 pandemic was high inflation. In many countries, inflation rates reached double-digits, which is significantly higher than the 2-3% typically targeted by central banks.
Generally speaking, an extended period of fast rising prices is not optimal because it erodes the purchasing power of money. This makes everyday essentials like groceries, rent, and gas more expensive.
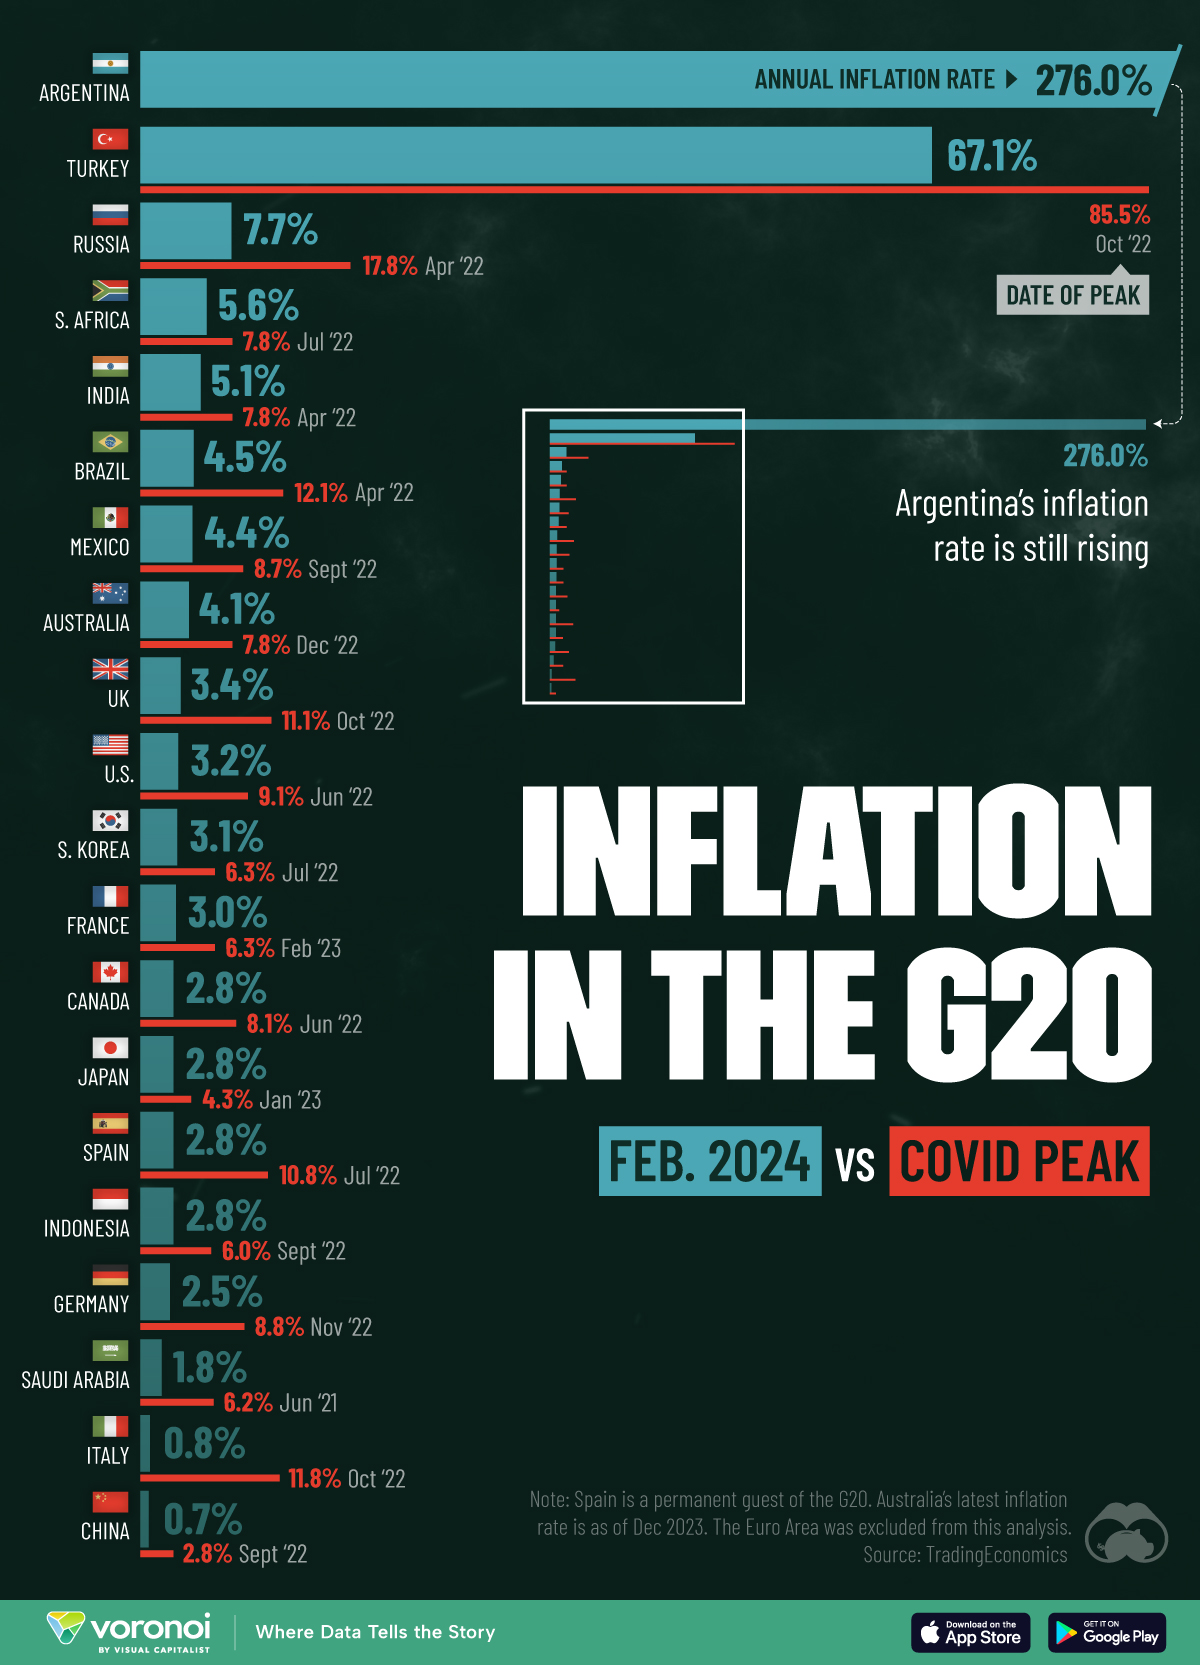
To see how inflation is currently faring, we’ve visualized annual inflation rates across G20 countries as of February 2024, in the context of their pandemic peak. This data was sourced from Trading Economics and can also be found in the table below.
| Country | Inflation (%, Feb 2024) | Inflation (%, COVID peak) | Date of Peak |
|---|---|---|---|
| 🇦🇷 Argentina | 276.0 | -- | -- |
| 🇹🇷 Turkey | 67.1 | 85.5 | Oct 2022 |
| 🇷🇺 Russia | 7.7 | 17.8 | Apr 2022 |
| 🇿🇦 South Africa | 5.6 | 7.8 | Jul 2022 |
| 🇮🇳 India | 5.1 | 7.8 | Apr 2022 |
| 🇧🇷 Brazil | 4.5 | 12.1 | Apr 2022 |
| 🇲🇽 Mexico | 4.4 | 8.7 | Sept 2022 |
| 🇦🇺 Australia | 4.1 | 7.8 | Dec 2022 |
| 🇬🇧 United Kingdom | 3.4 | 11.1 | Oct 2022 |
| 🇺🇸 United States | 3.2 | 9.1 | Jun 2022 |
| 🇰🇷 South Korea | 3.1 | 6.3 | Jul 2022 |
| 🇫🇷 France | 3.0 | 6.3 | Feb 2023 |
| 🇨🇦 Canada | 2.8 | 8.1 | Jun 2022 |
| 🇯🇵 Japan | 2.8 | 4.3 | Jan 2023 |
| 🇪🇸 Spain | 2.8 | 10.8 | Jul 2022 |
| 🇮🇩 Indonesia | 2.8 | 6 | Sept 2022 |
| 🇩🇪 Germany | 2.5 | 8.8 | Nov 2022 |
| 🇸🇦 Saudi Arabia | 1.8 | 6.2 | Jun 2021 |
| 🇮🇹 Italy | 0.8 | 11.8 | Oct 2022 |
| 🇨🇳 China | 0.7 | 2.8 | Sept 2022 |
Notes: Spain is a permanent guest of the G20. Australia’s latest inflation rate is as of Dec 2023.
Unlike other G20 nations, Argentina’s inflation rate has only gone up since the pandemic ended. This is largely due to the country’s history of printing money to compensate for government overspending.
One area hit particularly hard is food prices. According to a local consultancy, the price of beef to consumers rose by 40% to 70% between July to August 2023.
Learn More About Inflation in 2024
If you want to see more graphics on inflation, check out this global map that visualizes inflation forecasts for every country in 2024.


Misc
Visualizing the Most Common Pets in the U.S.
Lions, tigers, and bears, oh my!—these animals do not feature on this list of popular American household pets.


Visualizing The Most Common Pets in the U.S.
This was originally posted on our Voronoi app. Download the app for free on iOS or Android and discover incredible data-driven charts from a variety of trusted sources.
In this graphic, we visualized the most common American household pets, based on 2023-2024 data from the American Pet Products Association (accessed via Forbes Advisor).
Figures represent the number of households that own each pet type, rather than the actual number of each animal. The “small animal” category includes hamsters, gerbils, rabbits, guinea pigs, chinchillas, mice, rats, and ferrets.
What is the Most Popular American Household Pet?
Based on this data, dogs—one of the first domesticated animals—are the most common pets in the United States. In fact, around 65 million households own a dog, and spend an average of $900 a year on their care.
| Rank | Species | Households |
|---|---|---|
| 1 | 🐶 Dog | 65M |
| 2 | 🐱 Cat | 47M |
| 3 | 🐟 Freshwater Fish | 11M |
| 4 | 🐰 Small Animals | 7M |
| 5 | 🐦 Bird | 6M |
| 6 | 🦎 Reptile | 6M |
| 7 | 🐴 Horse | 2M |
| 8 | 🐠 Saltwater Fish | 2M |
Note: Households can own multiple pets, and are counted for all relevant categories.
Cats rank second, at 47 million households, and these smaller felines are a little less expensive to own at $700/year according to Forbes estimates.
But aside from these two juggernauts, there are plenty of other common pet types found in households across the country.
Freshwater fish can be found in 11 million households, along with small animals—rabbits, hamsters, guinea pigs—in 7 million. Meanwhile, nearly 6 million homes have birds or reptiles.
Pet Ownership is on the Rise in America
Forbes found that 66% of all American households (numbering 87 million) own at least one pet, up from 56% in 1988. One third of these (29 million) own multiple pets.
A combination of factors is driving this increase: rising incomes, delayed childbirth, and of course the impact of the pandemic which nearly cleared out animal shelters across the globe.
America’s loneliness epidemic may also be a factor. Fledgling research has shown that single-individual households with pets recorded lower rates of loneliness during the pandemic than those without a pet.

-

 Culture1 week ago
The Highest Earning Athletes in Seven Professional Sports
-

 Countries2 weeks ago
Population Projections: The World’s 6 Largest Countries in 2075
-

 Markets2 weeks ago
The Top 10 States by Real GDP Growth in 2023
-

 Demographics2 weeks ago
The Smallest Gender Wage Gaps in OECD Countries
-

 Economy2 weeks ago
Where U.S. Inflation Hit the Hardest in March 2024
-

 Green2 weeks ago
Top Countries By Forest Growth Since 2001
-

 United States2 weeks ago
Ranked: The Largest U.S. Corporations by Number of Employees
-

 Maps2 weeks ago
The Largest Earthquakes in the New York Area (1970-2024)